
Google Summer Of Code 2019 Idea Page
Welcome to GSoC 2019 in computational systems biology!
Our group works at the interface of computer science, biology, and mathematics by applying computational approaches to the seas of data in biomedical research. One of the main interests of our group is the development of technologies to make large-scale computational approaches accessible and more collaborative to a wider scientific audience, as well as to life sciences students who may or may not have been exposed to computational methods before. Our recent web-based technology, Cell Collective, enables scientists from across the globe to construct and simulate large-scale computational models of biological systems in a highly collaborative fashion. This software enables biomedical researchers to study the dynamics of biological systems (e.g., cells) under both healthy and diseased conditions. Cell Collective provides a unique environment for real-time, interactive simulations to enable users to analyze and visualize the multitude of effects a disease-related mal-function can have on the rest of the cell.
This very same modeling software is being used by thousands of life sciences students (see our user growth above) to learn about biological by the means of building, simulating, breaking, and re-simulating computational models of various biological processes. Tools that have been developed with the help of GSoC students over the last few years include ccNetViz (network visualization tool used in Cell Collective), CancerDiscover (high-throughput data analysis pipeline), Candis (graphical cancer biomarker discovery tool), etc. Our group consists of computer scientists, biochemists, biologists, bioinformaticians, as well as mathematicians, creating a unique environment of diverse skills, integrated by a single interest point.
We have been fortunate to work with some great students over the last three years of GSoC (check out their testimonials here).
Please join our Google Group for additional project details, questions, and discussions.
Before applying, please review this application template, as well as the GSoC Student Guide.
Cell Collective can be found at https://cellcollective.org and the more recent projects on GitHub
Below you can find our project ideas for GSoC 2019.
Idea 0: Your Own Idea!
Feel free to suggest your own idea. Our interests are within the general space of easy-to-use, interactive, data visualization in large-scale networks. Please be detailed about the specifics of your project, why it is important, and how you plan to achieve it.
Idea 1: Javascript/WebGL Library For Interactive Visualization Of Large-Scale Network Graphs: Advanced Custom Node And Edge Styling.
As a group interested in understanding the dynamics of complex networks via collaborative efforts, we have developed a new web-based, large-scale network visualization component. One of the main obstacles associated with this project is the ability to visualize networks on the web that are very large (tens of thousands of nodes and edges) and provide interactive features (moving/adding/removing nodes, zooming/panning, etc) while making it usable from a performance perspective in most modern web-browsers.
To address this issue we developed a new WebGL-based javascript network visualization library, Cell Collective Network Visualizer — ccNetViz. And it’s fast! Check out the example below (you can pan and zoom in these examples).
The purpose of this project is to extend its functionality by supporting advanced node styling (changing size, shape, displaying small graph/image inside) to integrate additional network data/information while keeping the overall performance of the library. Although CCNetViz is written mainly in JavaScript, this task requires good knowledge of WebGL.
Specific components of this project include:
Custom node border styling, data-driven (e.g., color and size) styles, inserted images. (see example here)
Support for custom node styles — e.g., Pie chart.
Custom edge styling such as edge type (dashed, dotted, etc.), color, and thickness, and edge arrow size and style.
Propose and implement a generic interface for inserting custom nodes and edges.
Create a simple pie chart example with pure HTML canvas.
Create live examples for these features on CCNetViz’ demo page
Document code and write corresponding UNIT tests.
Required skills: Javascript (ES6), WebGL
Potential Mentors: Ales Saska, Dr. Tomas Helikar
Difficulty Rating: High
Idea 2: Network Visualization Layouts.
We are looking to extend the network layout options within the aforementioned ccNetViz javascript library. In particular, we aim at:
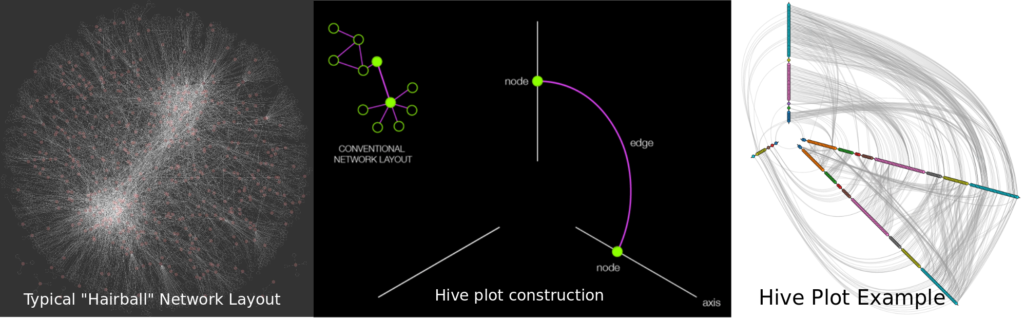
Developing the cutting edge Hive Plot layout (see below).
Implementing support for layout calculations inside web-workers. (All currently implemented layouts can be found in here.)
Developing extension support (API) — an example would be the import of layouts in CytoscapeJS
Improve unit testing for layout features.
Hive Plots: Biological networks are typically visualized using traditional force-based or spectral layout algorithms. While these algorithms are useful for small to medium-sized networks, they result in largely not-so-informative and irreproducible “hair-balls” when used for large-scale networks (left side of the figure below). To address these issues, hive plots were developed as a method to manage the visual complexity and generate informative, quantitative, and comparable network layouts. The Hive Plot is a linear network layout whereby nodes are organized along axes based on specified data attributes. In addition, the arrangement of nodes on each axis can also provide information about the type of data (node), providing an informative network visualization tool. An example of this layout can be seen in this D3.js component developed by Mike Bostock.
Required skills: Javascript (ES6), WebGL
Potential Mentors: Ales Saska, Dr. Tomas Helikar
Difficulty Rating: Easy
Idea 3: Javascript/WebGL Library For Interactive Visualization Of Large-Scale Network Graphs: Advanced Custom Label And Text Formatting.
The purpose of this CCNetViz project is to extend its functionality by supporting advanced label formatting while maintaining the overall performance of the library. Node labels in CCNetViz should support, for example, multi-line text and provide additional information by changing size, font, etc. Although the CCNetViz library is written mainly in JavaScript, this task requires good knowledge of WebGL. Because of the needed updates in the spatial search student should have also good knowledge of linear algebra :
Multiline support.
Add option for multiple borders
Different styling for separate pieces of the text (custom font style and sizes)
Improve the linear-algebra based spatial search (Add compatibility for advanced labels)
Document code and write corresponding UNIT tests
Required skills: Javascript (ES6), Graph Theory
Potential Mentors: Ales Saska, Dr. Tomas Helikar
Difficulty Rating: High
Idea 4: Web Pipeline For Flux Balance Analysis
Flux Balance Analysis is a type of popular Constraint-based Reconstruction and Analysis method for metabolic networks. While there are desktop-based tools for these analyses, web-based solutions are largely lacking. The goal of this project is to create a stand-alone web pipeline/service that will enable a user to submit an SBML model and select analysis methods (via a React-based GUI) to NodeJS and server-side microservices, which will, in turn, submit the simulation/analysis job to a backend COBRApy service. This service will subsequently return the simulation/analysis results through the API back to the React client for user viewing.
The following simulation/analysis methods should be available through this pipeline by the end of the project: Define objective functions, Flux balance analysis, Flux variance analysis, gap-filling.
One of the main objectives for this project is to define and implement a specific Data Structure for a Constrained-Based Model that can be tabulated within a PostgreSQL DataBase. The data structure must be JSON parsable on the client-side through a ReST-full API. The detailed Data Layer structure could be discussed during the Community-Bonding Phase of the Project Timeline.
For those new to constraint-based modeling, these papers might be useful: Orth et. al,Bordbar et. al
Required skills: Java, Javascript (ES6), React
Potential Mentors: Robert Moore, Achilles Rasquinha
Difficulty Rating: Easy
Idea 5: Javascript Library For Flux Balance And Variance Analysis
Flux Balance Analysis is a type of popular Constraint-based Reconstruction and Analysis method for metabolic networks. While there are desktop-based tools for these analyses, web-based solutions are largely lacking. As a compliment to Idea 3, the goal of this project is to build major analytical methods available in COBRA and COBRApy as a stand-alone JS library for the web-based analysis of metabolic networks. Should be NodeJS compatible.
The methods to be implemented in the library include gap-filling, flux variance analysis, and flux balance analysis.
For those new to constraint-based modeling, these papers might be useful: Orth et. al,Bordbar et. al
Required skills: Javascript (ES6), Node.js
Potential Mentors: Drs. Bhanwar Lal Puniya, Tomas Helikar
Difficulty Rating: Medium
Idea 6: Web Pipeline For Kinetic (ODE-Based) Models.
Ordinary Differential Equations are widely used to model biological networks and kinetic processes. While there are many desktop-based tools for these analyses, web-based solutions are largely lacking. The goal of this project is to create a stand-alone web pipeline/service that will enable a user to submit an SBML model and select analysis methods (via a React-based GUI) to NodeJS, which will, in turn, submit the simulation/analysis job to a backend simulation service (e.g., COPASI, CellDesigner, Systems Biology Simulation Core Library, etc). This service will subsequently return the simulation/analysis results through the API back to the React client for user viewing.
The following simulation/analysis methods should be available through this pipeline by the end of the project: Parameter fitting, steady-state analysis, simulation.
One of the main objectives for this project is to define and implement a specific Data Structure for a kinetic model that can be tabulated within a PostgreSQL DataBase. The data structure must be JSON parsable on the client-side through a ReST-full API. The detailed Data Layer structure could be discussed during the Community-Bonding Phase of the Project Timeline.
Required skills: Java, ReactJS, Javascript (data visualization packages such as D3), CSS3, HTML5
Potential Mentors: Robert Moore, Rauf Shah, Achilles Rasquinha
Difficulty Rating: Medium
Idea 7: Reaction-Based Model (Differential Equations) Analysis Library For JavaScript
Related to Idea 5, the objective of this project is to develop a stand-alone javascript library that will enable the evaluation and simulation of the differential equation-based models of biological processes. The following simulation/analysis methods should be available through this library by the end of the project: Parameter fitting, steady-state analysis, simulation. This library will be demonstrated through a simple web UI which will enable a user to upload an SBML file with a computational model, set up a simulation/analysis, and visualize the results of the analysis. The library can leverage other open source javascript libraries, such as numericJS, libSBML (for parsing, and processing SBML files).
Required skills: Javascript (ES6), NodeJS
Potential Mentors: Robert Moore, Dr. Tomas Helikar
Difficulty Rating: Medium
Idea 8: Interactive Web Platform For R-Based Data Analysis
Most statistical technologies require users to be familiar with the command line and/or some type of a higher-level programming language, making statistics less accessible to those who are not familiar with these technologies. The technology already provides access to many sdata visualizations and analyses, including tabular data upload/visualization, descriptive statistics, t-tests, graphing, one-/multi-way ANOVA, clustering, classification, principal component analyses, and heatmaps. It also provides an interactive command-line snippet manager in the web browser that allows users to learn R programming in a scaffolded fashion. The goal of this project is to develop a production-ready version of a cross-platform web-based application that enables anyone to perform various statistical computations in an easy-to-use, interactive, and graphical manner. Specifically, the selected student will: Dockerize the application to make it more production-ready which will involve integrating various services such as R, Django, React, Postgres services, etc. Develop a custom OpenCPU service
Required skills: R, React, Javascript, D3.js, high-throughput data analysis, and visualization experience preferred
Potential Mentors: Tomas Helikar, Achilles Rasquinha
Difficulty Rating: Easy
Idea 9: Javascript/WebGL Library For Interactive Visualization Of Large-Scale Network Graphs: Edge Animations.
We are looking to extend our WebGL-based javascript network visualization library, Cell Collective Network Visualizer — ccNetViz to support animation of edges. An example of such animation can be seen in the network visualized here. (Don’t worry about any of the AI stuff on that page; the link is supposed to be only an example of what ccNetViz should support for the animated edges). And it’s fast! Check out the example below (you can pan and zoom in these examples).
The animation should support customization by a dev user. Examples of customization should be the animated color, speed, as well as some pre-set styles.
Required skills: Javascript (ES6), WebGL, Graph Theory
Potential Mentors: Ales Saska, Resa Helikar
Difficulty Rating: High
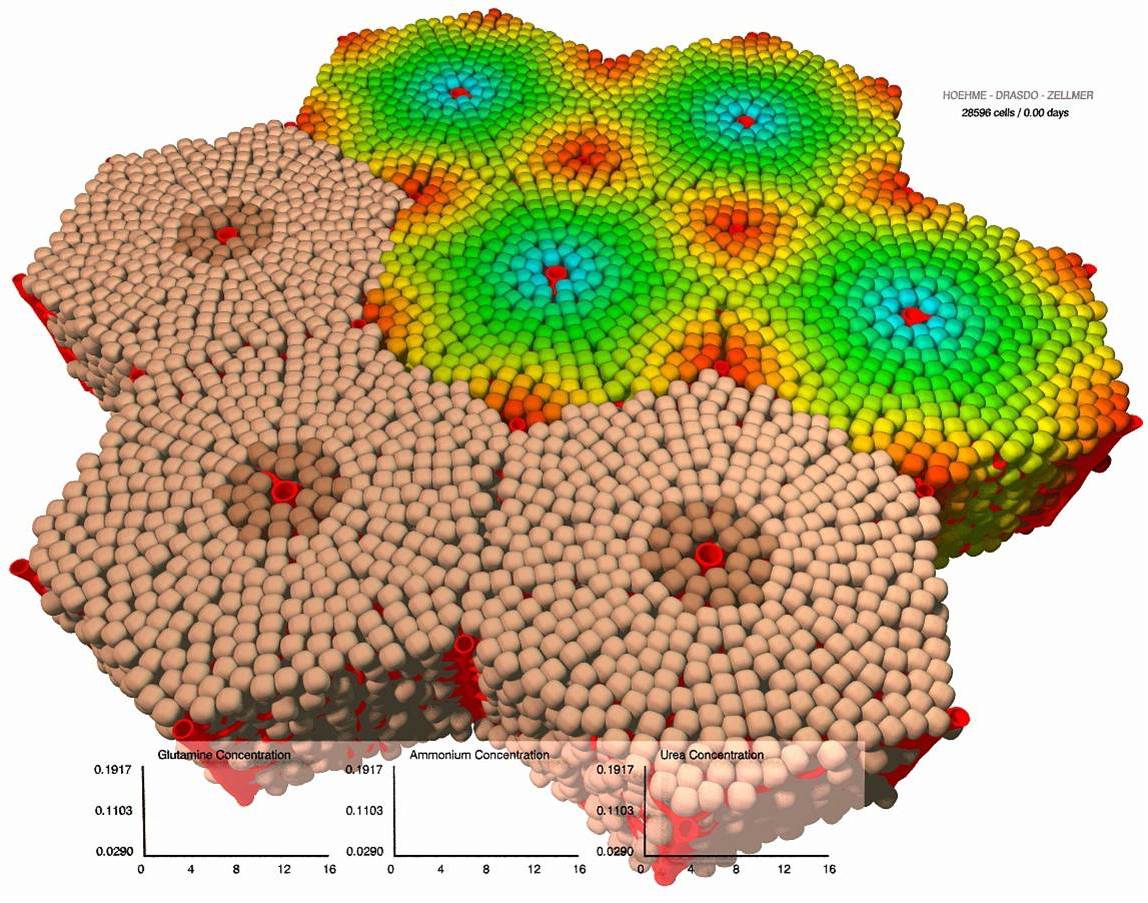
Idea 10: Generic Javascript Framework For Agent-Based Modeling.
The goal of this project is to develop a stand-alone javascript library to create and simulate agent-based models. Agent-based modeling (ABM) is a widely used technique to model systems of autonomous and mutually interacting agents. ABM has been used in many fields, including life sciences with various objectives and applications, for example, to predict the spread of a pathogen, cancer development, cell differentiation, etc. Given its long history, ABM has strong theoretical and practical foundations with a wide variety of desktop-based software and methods for developing and simulating agent models. To facilitate a more collaborative environment for ABM in life sciences, we aim to also bring ABM to the web through this Javascript-based ABM framework. The framework will consist of Agents that live and communicate in a 3-dimensional environment (utilizing threeJS) in a distributed and independent fashion. Each agent will be able to: move, receive signals from the environment, die, and divide. Agents will also be able to assume geometrical shape; however, in this version, they can all be of the same geometry (e.g., a sphere). You can review NetLogo (a widely-used desktop ABM software) to learn more about ABM.
Required skills: Javascript (ES6), three.js, agent-based modeling (preferred)
Potential Mentors: Dr. Tomas Helikar
Difficulty Rating: High
Idea 11: Candis: A Software Tool For Cancer Prediction And Biomarker Identification Using High-Throughput Data
Machine learning tools for cancer class prediction and biomarker discovery can hasten cancer detection and significantly improve prognosis. However, current cancer prediction methods lack the interface that offers interactivity, flexibility, modularity, and data visualization for users. To address these issues, we develop an open-source browser-based database-driven GUI (Graphical User Interface) application, Candis, for cancer classification and biomarker identification using gene expression data (to distinguish cancer from normal samples, as well as different subtypes of cancer). Candis is built using ReactJS frontend and Flask-based backend. The easy-to-follow application interface enables researchers to access their local and remote gene expression data (search and download data from the NCBI database) and build cancer prediction machine, learning models. In addition to handling large datasets, the application also provides an intuitive method to create experiments, add additional data fields (e.g., Patient’s demographic data), pre-process and normalize data, including the ability to conduct feature selection and classification analysis. Candis is platform-independent and comes with an easy-to-follow installation and operation instructions. Candis is useful for biomedical researchers with no computer programming background and is interested in performing cancer biomarker identification and cancer class prediction analyses on their computer. Check out a brief demo of the tool below!
The purpose of this project is to expand Candis’ machine learning services and tools to include deep learning, in particular by incorporating python tensor flow, pytorch. In addition, the student will be responsible for maintaining the stability of the platform by addressing various bugs.

Required skills: ReactJS, Flask, Python, high-throughput data analysis, and visualization experience preferred.
Potential Mentors: Achilles Rasquinha, Tomas Helikar
Difficulty Rating: Easy
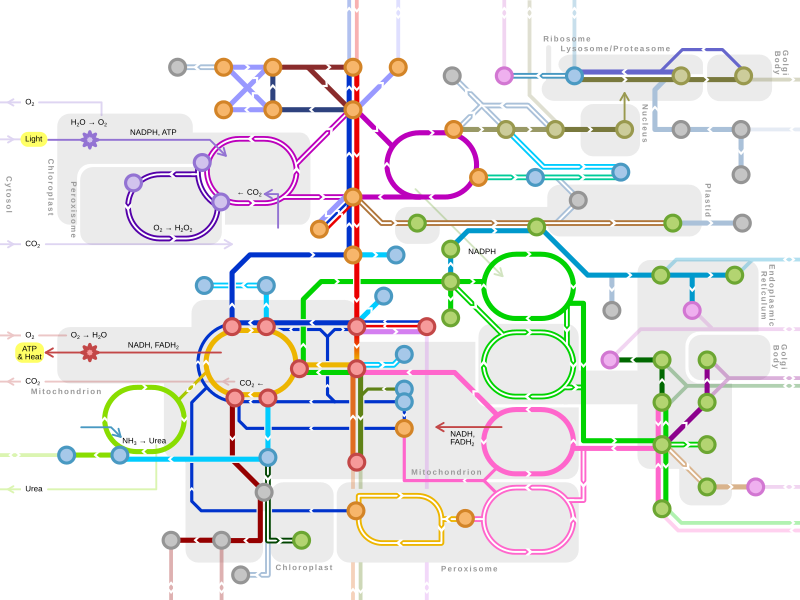
Idea 12: Interactive Visualization Of Mass-Flow Networks With CCNetViz
Networks are used in visualizing a variety of biological systems. Signaling and gene regulatory networks are often described as a composition of interactions or relationships between nodes and components of signaling or gene regulatory. However, the resulting node-and-edge graphs are visually distinct from the more familiar ‘metabolic map’ layout where lines show the flow of reactants coming together before branching into products (see below). The goal of this project is to modify the CCNetViz network visualization library (currently focused on node-edge graphs) and develop a new “mode” that will enable visualization of metabolic and/or kinetik network models.
Required skills: Javascript, WebGL.
Potential Mentors: Robert Moore, Bhanwar Lal Puniya
Difficulty Rating: Medium